Disclaimer: Personal homelab project. Views are my own. Built and described in the open as a working reference, not a product pitch, not a roadmap, not a customer reference.
TL;DR
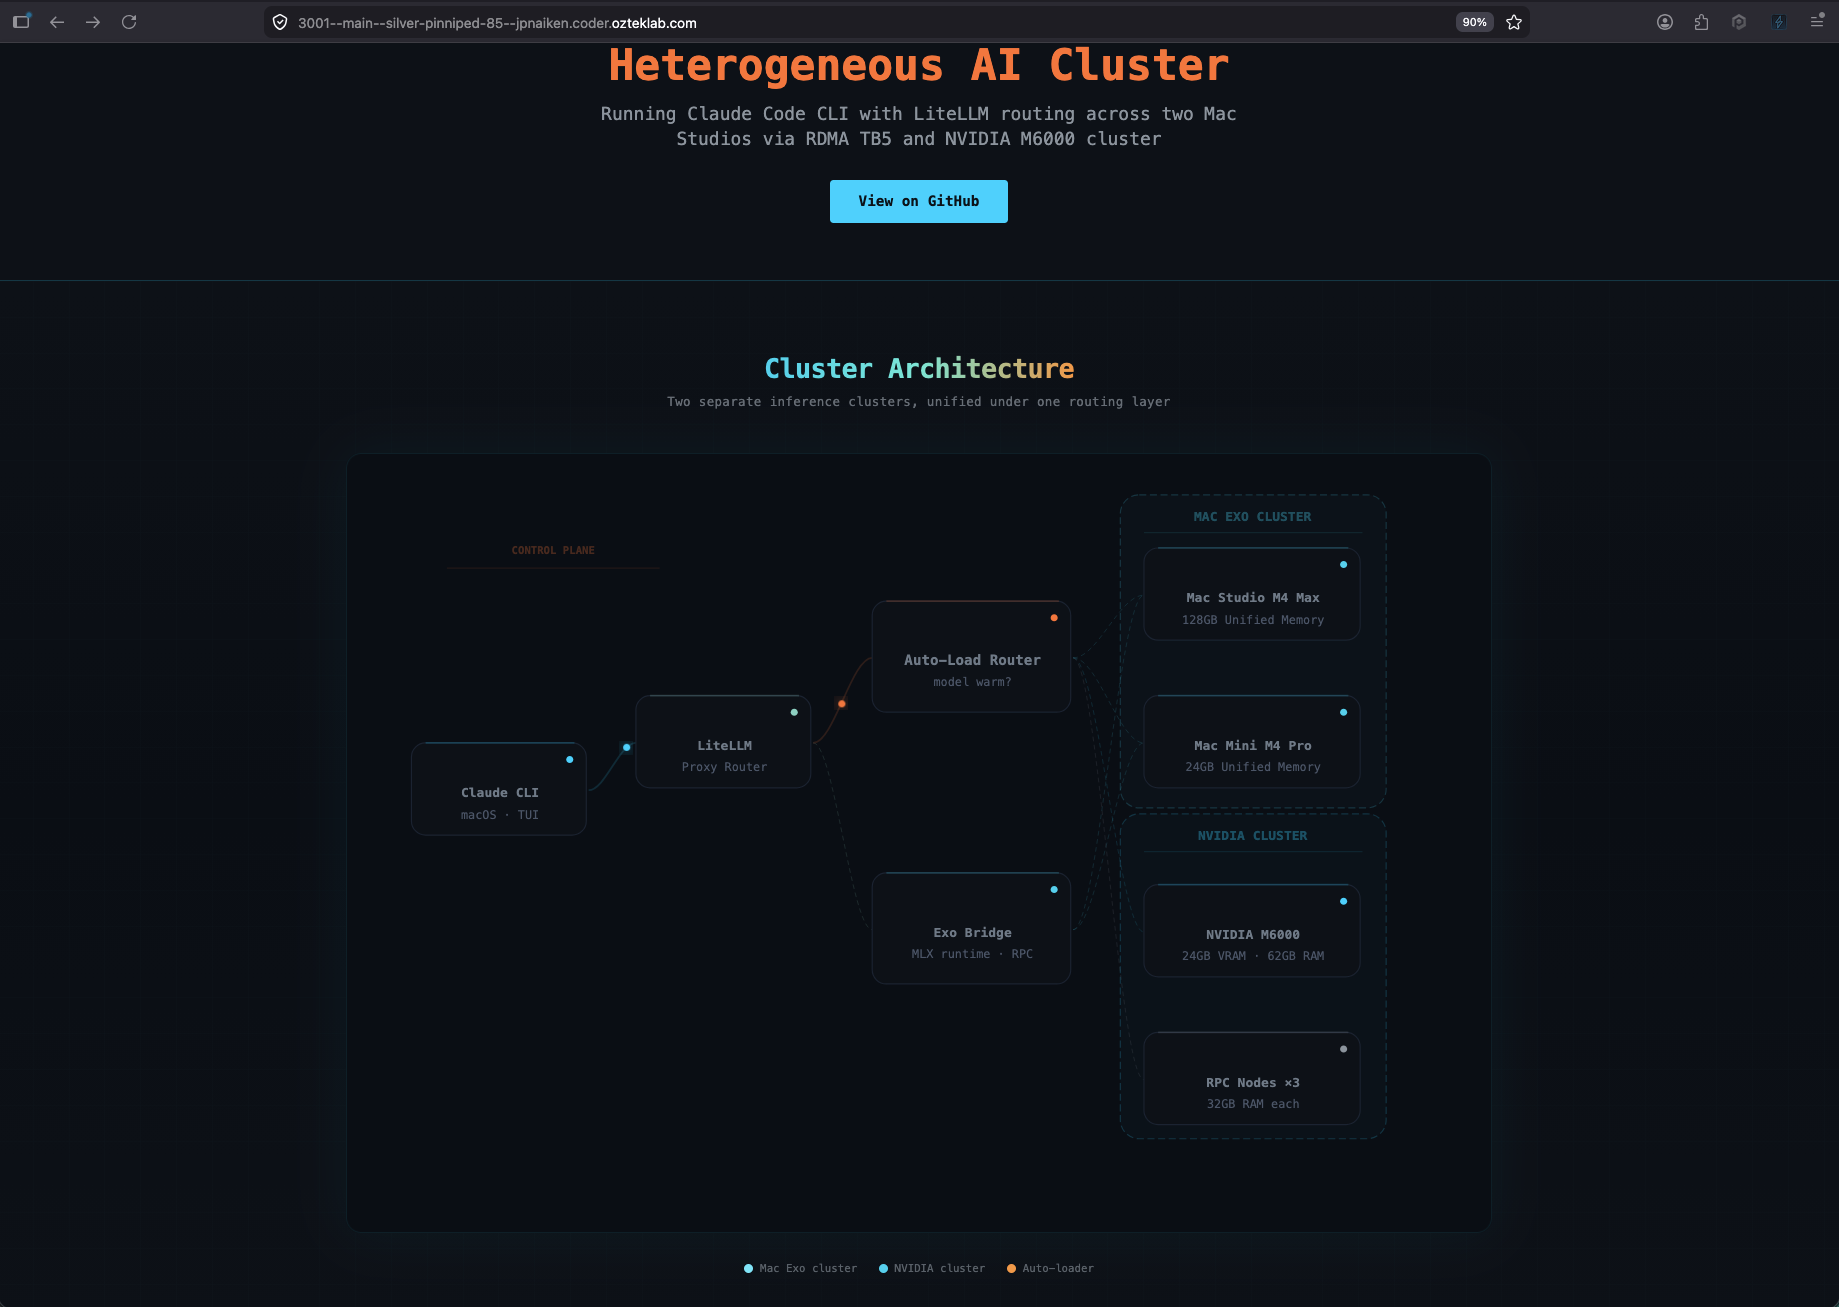
I extended my existing tri-stack observability layer to cover a second LLM cluster, Apple Silicon MLX on top of the existing NVIDIA llama.cpp side, and added Apple-silicon power telemetry as a first-class OTel metric. One LiteLLM front door routes traffic to either backend. One OpenTelemetry Collector fans the metrics, traces, and logs out to SigNoz (self-hosted), Splunk Enterprise (on-prem), and Splunk O11y Cloud. A 120-line Python adapter wraps the macmon binary that ships inside EXO.app and emits mac.power.{total,cpu,gpu,ane,ram} every five seconds.
If you skim, jump to the four gotchas section, that's the engineering content. The architecture sections are scaffolding for them.


Here's what it actually looks like
The diagram is the intent. These next two screenshots are the receipts, both clusters serving a real model right this second.
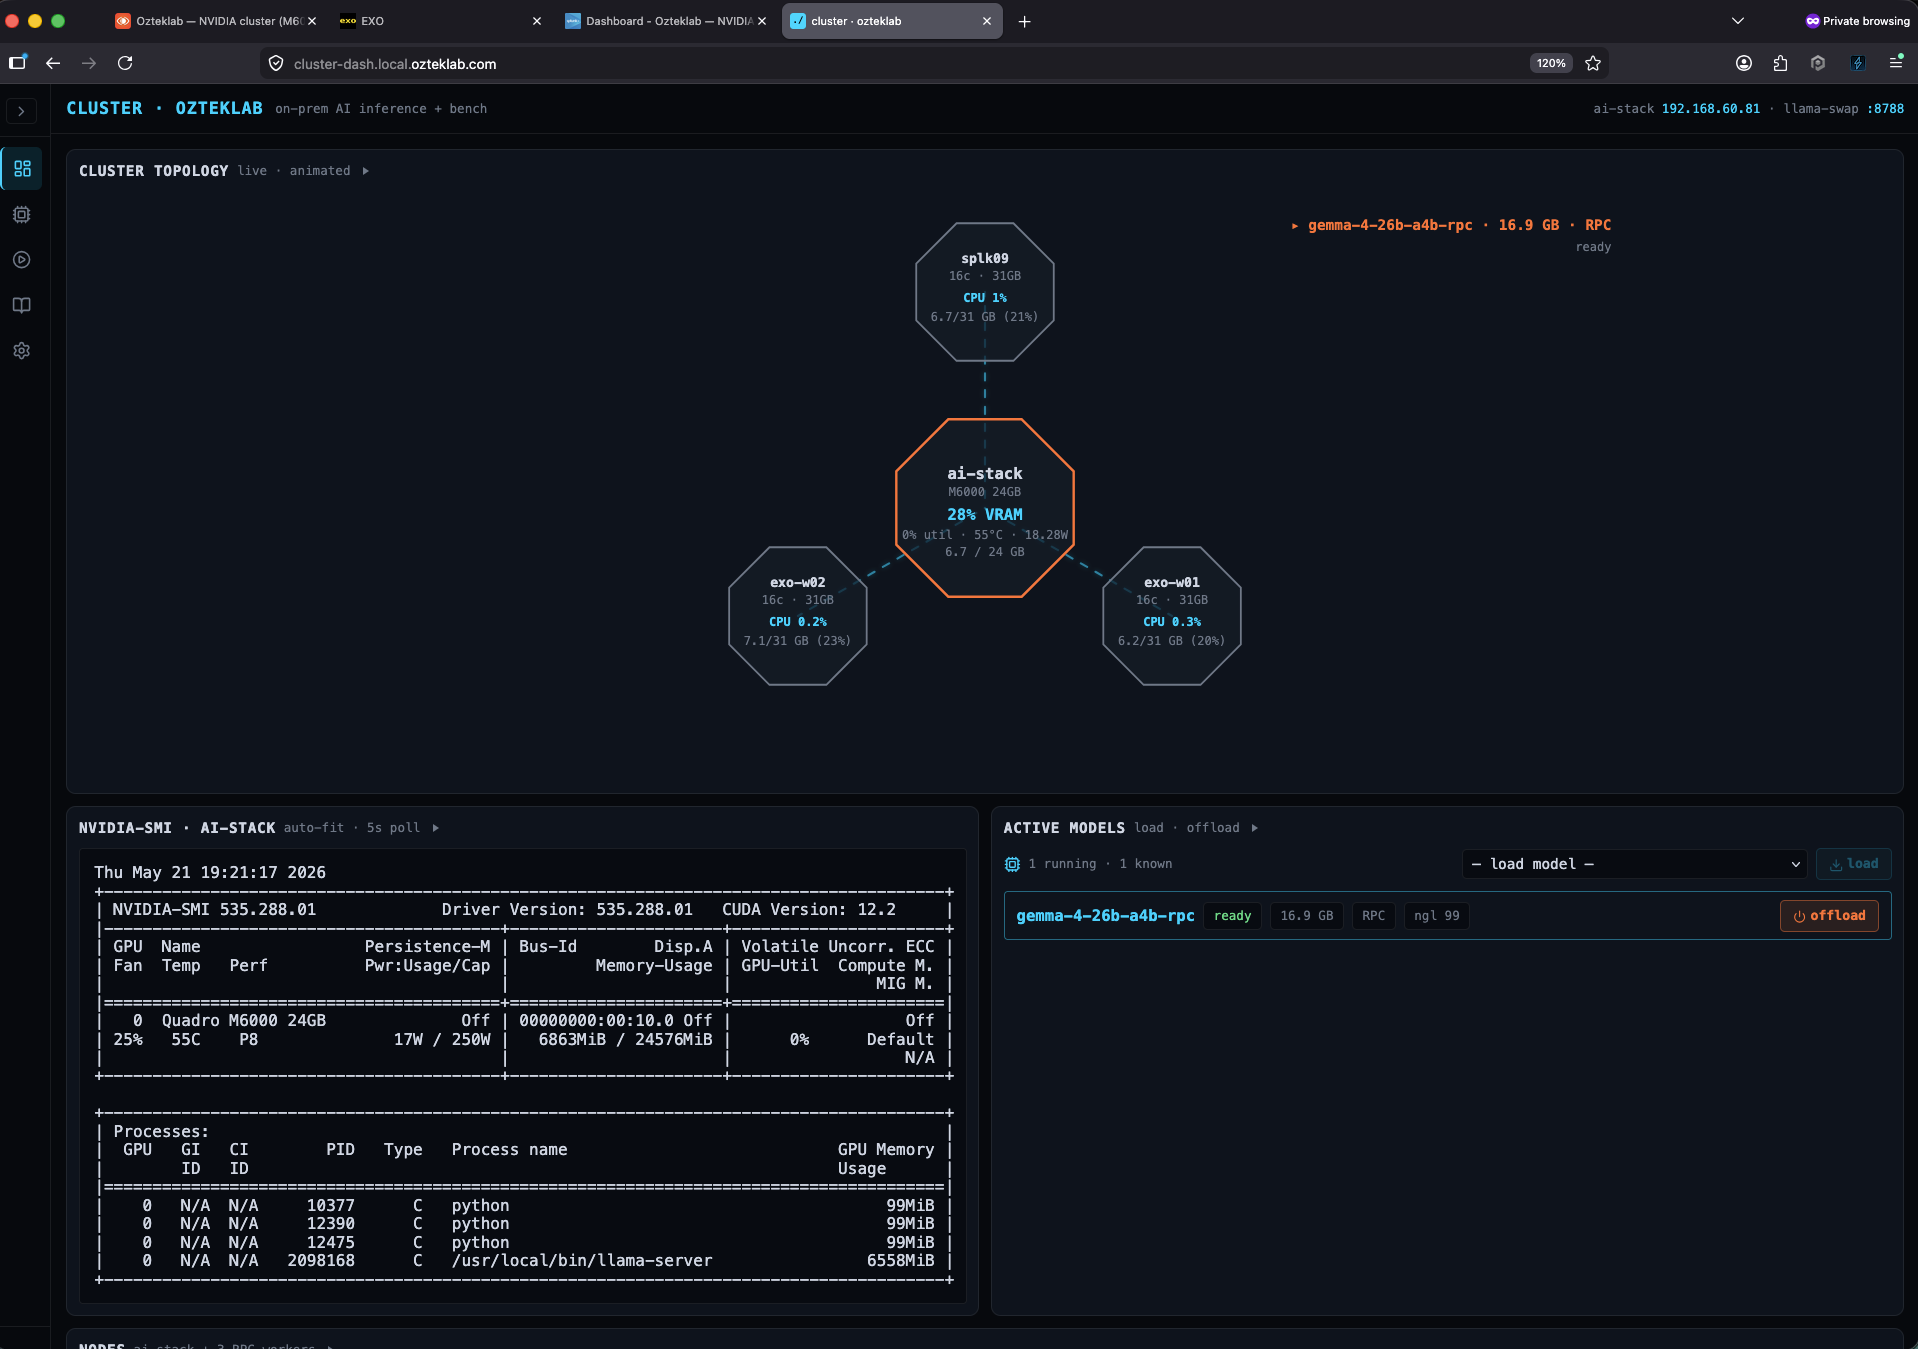
The NVIDIA side, ai-stack + three RPC workers
ai-stack (NVIDIA Maxwell M6000, 24 GB VRAM) sits in the centre of the octagon topology as the prefill node, with rpc-w-01, rpc-w-02, and rpc-w-03 fanning out as llama.cpp RPC workers. The currently loaded model in this shot is gemma-4-26b-a4b-rpc, a 16.9 GB GGUF that's been sharded across the M6000 plus the three RPC workers so the whole thing fits without anyone swapping. Live nvidia-smi is pinned underneath so you always see the truth of what the M6000 is actually doing right now, not what the dashboard thinks it's doing.
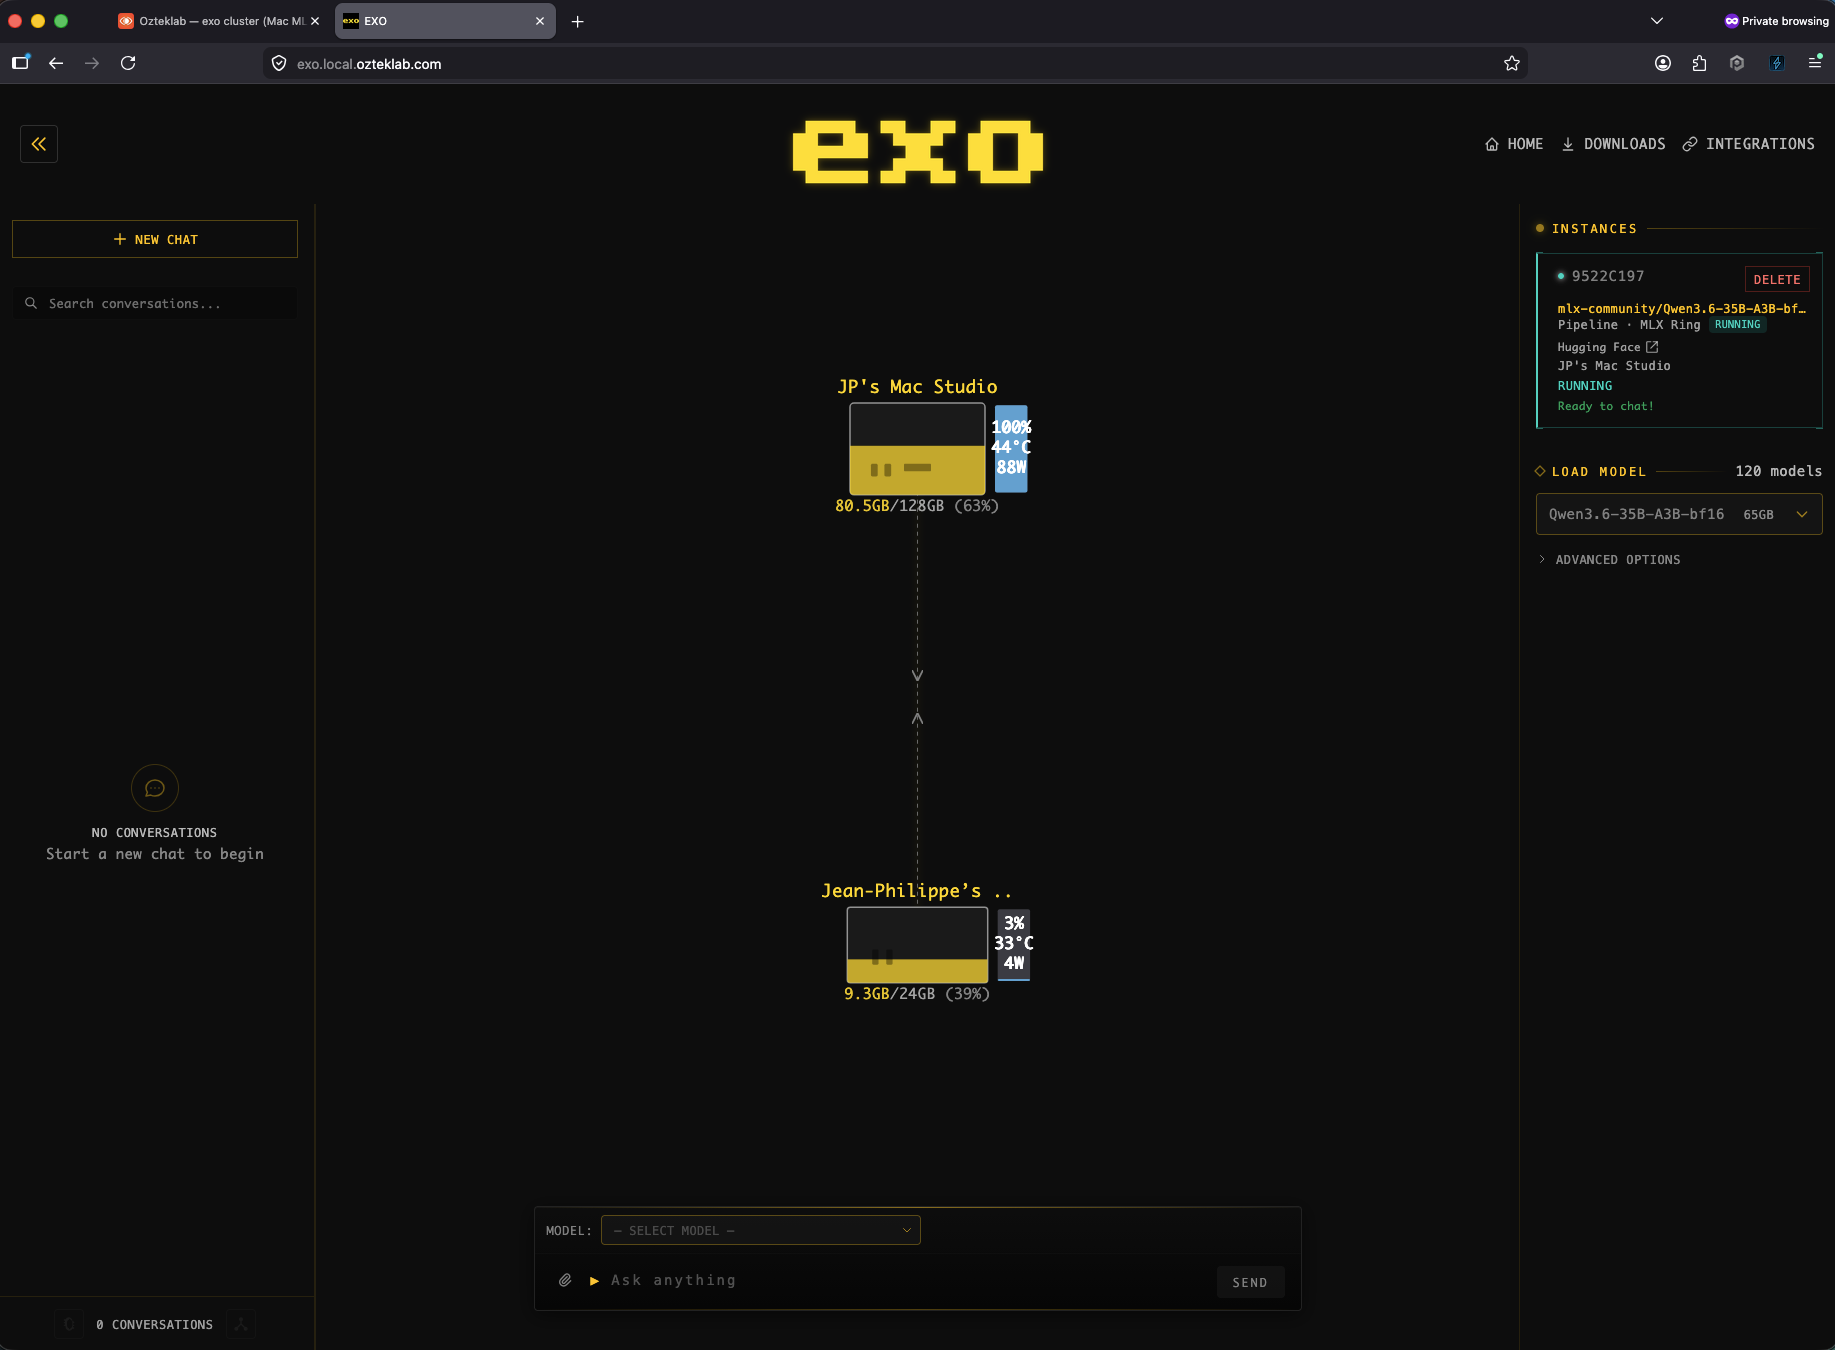
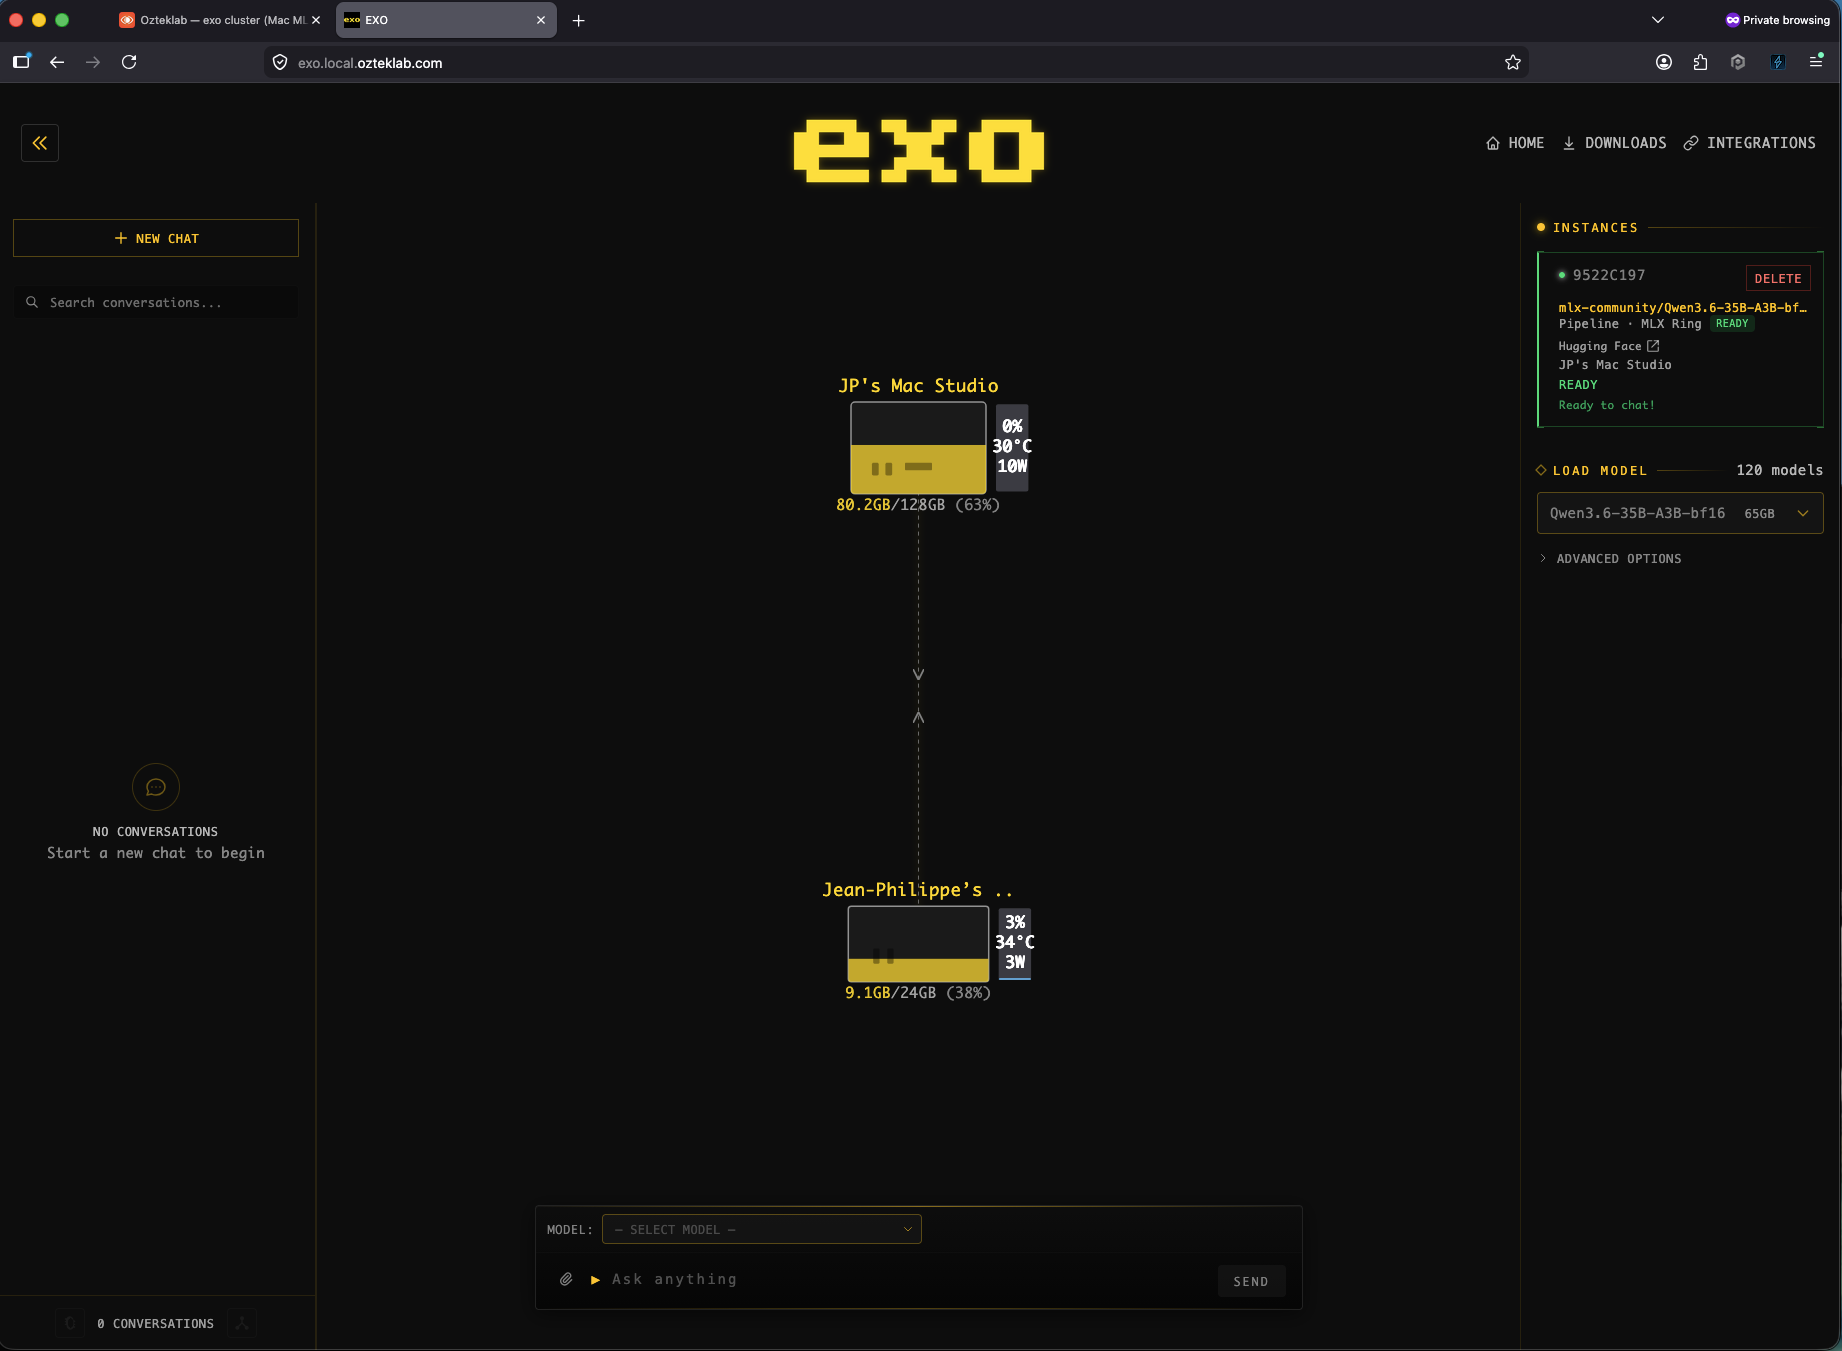
The Mac side, an EXO ring across Studio and Mini
This is EXO.app's own UI on the Mac Studio. Two peers in the MLX Ring, JP's Mac Studio (M4 Max, 128 GB unified memory) doing the heavy lifting at 100 percent GPU, 44 degrees, 88 watts, and the Mac Mini participating at 3 percent, 33 degrees, 4 watts. The model running across both is mlx-community/Qwen3.6-35B-A3B-bf16, a 35B-parameter MLX build that fits comfortably in 128 GB of unified memory without RPC sharding. The per-Mac wattage is the unique signal, that's the on-prem-Apple-silicon-power story this post is really about, and the next sections are how those watts end up as a queryable OTel metric in SigNoz and Splunk.
The rest of this article is how those two views happen end to end and what made them annoying to build. Splunk + SigNoz dashboards, gotchas, the lot.
1. Why two clusters (and why hardware backstory matters here)
The NVIDIA side already ran fine: an NVIDIA M6000 24 GB plus three llama-server --rpc workers (rpc-w-01/02/03) for the 70B+ models that don't fit on one card.
A small digression on the M6000, because it's the part everyone in the local-LLM scene rolls their eyes at. The M6000 is a 2015 Maxwell card. By most people's reading, it's e-waste, no FP16, no tensor cores, no FlashAttention, ECC-disabled when used as a desktop card. The cope is real. But: it's still 24 GB of VRAM with 317 GB/s memory bandwidth at idle wattage roughly equal to a modern mid-range card, and llama.cpp knows exactly how to use it.
Real numbers from the cluster-dashboard benchmark history, M6000 alone vs the same hardware sharded across the three RPC workers:
| Model (Q4_K_M GGUF) | M6000 standalone | M6000 + 3 RPC workers | Notes |
|---|---|---|---|
llama-3.2-1b | ~130 tok/s (peak 133) | not run (fits trivially on one card) | small models live on the card, no need to shard |
qwen2.5-coder-14b | ~15 tok/s | not run | coder workload, fits in 24 GB at Q4 |
gemma-4-26b-a4b | ~32 tok/s (peak 34.7) | ~9 tok/s (range 8.0-9.6) | the smoking gun. Same model, same hardware, just toggling RPC. 4x slower across the wire. |
The 26B row is the whole story. Standalone on the M6000, it's a perfectly usable 32 tok/s. The moment you shard it across the three RPC workers, you eat a 4x throughput hit, and that's with the underlay sitting on a 10 GbE switching fabric (this lab is not on consumer-grade 1 GbE anywhere it matters). Honest read on what 10 GbE actually gets you: it's enough to land big shards on the workers, it is not enough headroom to make per-token RPC inference feel like a local card. I also tried tinygrad's multi-GPU path on the same hardware as a side experiment, the connection works fine, the throughput sits in the same disappointing range, which tells me the bottleneck is the wire, not the framework. Even sm_70 contemporary papers and PoCs put 70B multi-host inference around 19 to 21 tok/s on real silicon, close to what we measure.
To make RPC inference actually sing you need the next tier up: 50 GbE or 100/200 GbE QSFP fabric with RDMA, the kind that's been standard in datacenters for years and is finally turning up in prosumer boxes. The NVIDIA DGX Spark (GB10 Grace-Blackwell, "personal AI supercomputer") ships with two ConnectX-7 200 GbE QSFP56 ports plus a 10 GbE RJ-45, and is explicitly designed to cluster two units over the QSFP link for 405B-parameter inference. The ASUS Ascent GX10 (same GB10 silicon, ASUS chassis) ships the same ConnectX-7 dual-QSFP layout with an optional 400G DAC cable. The GX10 in particular is on my own shortlist to add to this lab, the ConnectX-7 fabric is exactly the missing piece that takes multi-host inference from "works" to "wants to be its primary mode". When (not if) that hardware lands, the existing M6000 + V100 RPC ring gets to ride a real fabric for the first time, and the 4x penalty in the table above is the number I expect to evict.
RPC isn't a free lunch, it's the price you pay to fit a 70B-class model that doesn't fit on one card. For anything that DOES fit in 24 GB, standalone wins decisively. That's the architecture call this whole cluster is built around: route models by what fits, not by what's "available".
So no, the M6000 is not "fast" in 2026 terms. It is, however, capable, cheap, and here, and 32 tok/s on a 26B is genuinely usable for everything except agentic coding loops. The setup is already wired for an SXM2 V100 32 GB drop-in next month, second-hand server-pull SXM2 boards with custom PCB carriers are a real path for the patient hardware crowd, once that lands, the M6000 stays in the rig as a second card for embeddings, vision pre-processing, and the small models the router doesn't need to swap. Nothing gets thrown out; everything gets a job.
What changed this week: I added an EXO cluster on the Mac side, Mac Studio M4 Max (128 GB) plus a Mac Mini (24 GB), so the same LiteLLM proxy can route to either MLX-on-Apple-Silicon or GGUF-on-CUDA depending on the model. Two reasons:
- MLX dominates on Apple Silicon for memory-bound models. A 35B Qwen3-Coder in 6-bit MLX fits trivially in 128 GB of unified memory and saturates the M4 Max GPU without any swapping. The M6000 has to RPC-shard the same model across three VMs.
- It's a real-world A/B. Same prompt, same LiteLLM client, two backends, instant comparison of latency, throughput, and (now) power-per-token across architectures. That comparison is the whole point of this post.
The cluster boundary lives in cluster=mac-exo vs cluster=nvidia resource attributes on every OTel emission. Dashboards filter on it; alerts route on it.
Aside: the AI hardware squeeze of 2026. I bought the Mac Studio M4 Max with 128 GB unified memory when that tier was still on the order page. The squeeze has now hit both chip lines:
- M4 Max (the one I have) used to offer a 128 GB unified memory tier. As of May 2026, the maximum M4 Max config you can currently order from apple.com is 96 GB, the 128 GB tier I bought into is gone from the order page.
- M3 Ultra is the high-memory line, that's where the 256 GB and 512 GB unified-memory tiers lived. Apple has pulled the 512 GB Ultra upgrade entirely and the price for the remaining high-memory Ultra upgrades jumped over the same window per Tom's Hardware. Delivery on Ultra configs has slipped to 11 to 13 weeks globally as of writing.
Australian buyers feel it harder once duty and the apple.com.au markup are applied. Today on apple.com/au:
- M4 Max base (36 GB): from A$3,499
- M4 Max 64 GB: A$4,549 (16-18 week ship)
- M3 Ultra (96 GB unified memory included): from A$6,999 (11-13 week ship)
- M3 Ultra with 32-core CPU + 80-core GPU (96 GB): A$9,249
The pricing jumps are not gentle. Going from M4 Max 64 GB to the entry M3 Ultra 96 GB is roughly AU$2,450 for the privilege of more unified memory (because today you can't actually buy a higher-memory M4 Max in Australia, the path forward at >96 GB is Ultra-only).
RAM commodity prices are at record highs, the squeeze isn't a rumour, it's right there on the order page. The numbers behind this lab tell the timing story. The live NVIDIA inference cluster sits on ~184 GB of DDR4 ECC plus the M6000's 24 GB of VRAM (
ai-stackcarries 64 GB, the three llama.cpp RPC workers carry 32 GB each), all bought across years of patient second-hand server pickups well before the squeeze. The Mac side adds 152 GB of unified memory (the 128 GB Mac Studio M4 Max plus the 24 GB Mac Mini); my Apple-silicon experience predates this build by years too, the M1 has been in the family since 2022. And under all of that, the broader Proxmox lab sits on just over 1 TB of physical RAM across five PVE nodes (HL-PVE-03 alone is 502 GB), so there's headroom to stand up more workers any time the cluster needs them, without paying 2026 spot prices for the privilege. Anyone trying to build this exact stack from scratch today would pay considerably more than I did, in both USD and AUD, and wait roughly twice as long. If you have memory in a drawer, the AI-on-prem story is still open. If you don't, the window narrows."Just wait for WWDC / M5 Mac Studio?" Tempting. The natural move is to hold for WWDC 2026 in June, expect Apple to announce the M5 Mac Studio, and hope the unified-memory ceiling goes up. The leaks don't agree with that hope. Per Macworld and Geeky Gadgets, the M5 Mac Studio is now expected to slip from a WWDC reveal to roughly October 2026, explicitly because of the same global DRAM shortage. And the rumoured ceilings actually regress: the M5 Max is expected to top out at 128 GB (same as the M4 Max tier Apple just removed from the order page), and the M5 Ultra is expected to top out at 256 GB, down from the M3 Ultra's old 512 GB ceiling that already got pulled in March.
So we're in the absurd position where, today, the easiest way to buy a brand-new 128 GB Apple Silicon machine is a MacBook Pro M4 Max, the laptop still ships with that tier on apple.com.au, while the desktop workstation in the same chip line has been quietly downgraded to 96 GB. If your AI-on-prem plan was "wait for the next Mac Studio and get more memory than I can get today", the current best guess is: you're going to wait until late 2026, and you're probably going to get the same memory ceiling or less. So "wait" might also mean "buy a MacBook Pro instead and pretend it's a server", which, honestly, more than one person in the local-LLM scene is now doing.
2. The router: one LiteLLM, two backends
LiteLLM sits in the middle as the OpenAI-compatible front door. Every model is registered with a friendly name and routed to its right backend:
The OTel callback emits gen_ai.client.* metrics (LLM request duration, token usage, operation duration) in addition to the standard span traces. That's the telemetry surface every dashboard panel in this post is built on. Important detail: you have to set LITELLM_OTEL_INTEGRATION_ENABLE_METRICS=true as an env var, without it, only traces flow, no metrics. I lost an hour chasing that one yesterday.
Two side-cars sit between LiteLLM and the actual model servers:
exo-router(:8767on dockerhost): a FastAPI lazy-loader I wrote for the Mac side. EXO.app on Mac Studio holds the model; the side-car wakes it on first request and applies a 30-min TTL eviction.llama-swap(:4004on ai-stack): TTL-managedllama-serverinvocations for the NVIDIA side. Drop-in upstream tool. Swaps between models on demand based on the OpenAI-stylemodelfield in the request.
Both side-cars are decorated with the OTel SDK so the trace tree shows client → litellm → exo-router → mac-studio or client → litellm → llama-swap → m6000 → rpc-w-01 end-to-end in SigNoz APM.
2.1 The gateway layer above LiteLLM
LiteLLM is the router. It is not the policy/guardrails surface, that lives in front of it. Three OpenAI-compatible gateways on ai-gw-01 decorate every request before it ever reaches the router:
| Gateway | Role | Why it's its own box |
|---|---|---|
| AI-GW-01 / OpenCLAW | Policy + structured logging + per-tenant token accounting | OpenAI-compatible endpoint that wraps every call with audit-grade logging (CLAW = "Control, Logging, Audit, Workflow"). Sits between the agentic clients and LiteLLM. Lets me say "show me every prompt that touched a model in the last 24h, by team, with the redacted body" without hot-patching the proxy. |
| NeMo CLAW | Content safety, jailbreak detection, output rails | Wraps NVIDIA NeMo Guardrails (Python sidecar). Refuses inputs that match prompt-injection patterns; rewrites outputs that leak secrets. Same OpenAI shape, so any client that talks to GPT-4 talks to this one. |
| Hermes Agent | Multi-step agentic reasoning loop | Tool-using agent that wraps LiteLLM. Plans, calls MCP tools (Splunk, Proxmox, TrueNAS, Outline, Plane, Grist), and returns the synthesized answer. The client thinks it's talking to a smart model; it's really a planner-executor chain backed by whatever model LiteLLM routes to. |
All three speak the OpenAI /v1/chat/completions shape, route into LiteLLM, and ultimately land on either the NVIDIA cluster (default for tool-using agents because llama-swap holds the model warm) or the Mac MLX side (default for high-context coding). Each gateway emits its own OTel traces, so the SigNoz APM tree shows client → ai-gw-01 → litellm → llama-swap → m6000 end-to-end, with per-hop latency. The trace tree is the killer feature here, most local-LLM stacks treat the gateway as opaque; with OTel everywhere, every hop is queryable.
The Claude Code CLI is the one client that bypasses the gateways and talks to the Mac side directly via the exo-router lazy-loader. Reason: Claude Code drives long agentic loops that thrash the gateway logging volume, and for IDE-style coding work I want the MLX latency floor (~50 ms vs ~200 ms through the full stack).
3. The model supply chain: HuggingFace → Nexus → KitOps → Harbor → llama-swap
This is the part most "local LLM" posts skip. Pulling a GGUF from HuggingFace into llama-swap and serving it works as a demo, sure, but treating models as artifacts you manage (signed, versioned, mirrored, internal-only) is what makes the difference between "I've got Ollama running" and "I've got a model registry". The lab runs the whole pipeline end-to-end.


Nexus: every outbound dependency lands here first
Nothing in the lab pulls directly from the public internet for application dependencies. Everything goes through Nexus Repository Manager at nexus.ozteklab.com, which runs five proxy repositories: pypi-proxy, npm-proxy, github-raw-proxy, raw-vendor (HuggingFace + Ollama mirror), and docker-hub-proxy (containerd registry mirror for the K3s nodes). The pip / npm / docker clients on every host are wired to Nexus first, public registries second. Three reasons that matter beyond aesthetics:
- Supply-chain hygiene. A pinned and proxied dependency is one that can't change under you. Nexus caches the exact tarball / wheel / image manifest it served the first time. PyPI yanks a package mid-deploy? Doesn't matter, Nexus still has the original artifact.
- Audit + reuse. Every pull is logged. I can grep "who pulled which transformers version when" across the whole lab, which is genuinely useful when a CI run goes sideways.
- Offline survivability. If the internet goes down, the lab keeps building. Critical for the 70B-shard rebuilds when those take 20 minutes to fetch weights and you don't want a fragile WAN link in the middle of that.
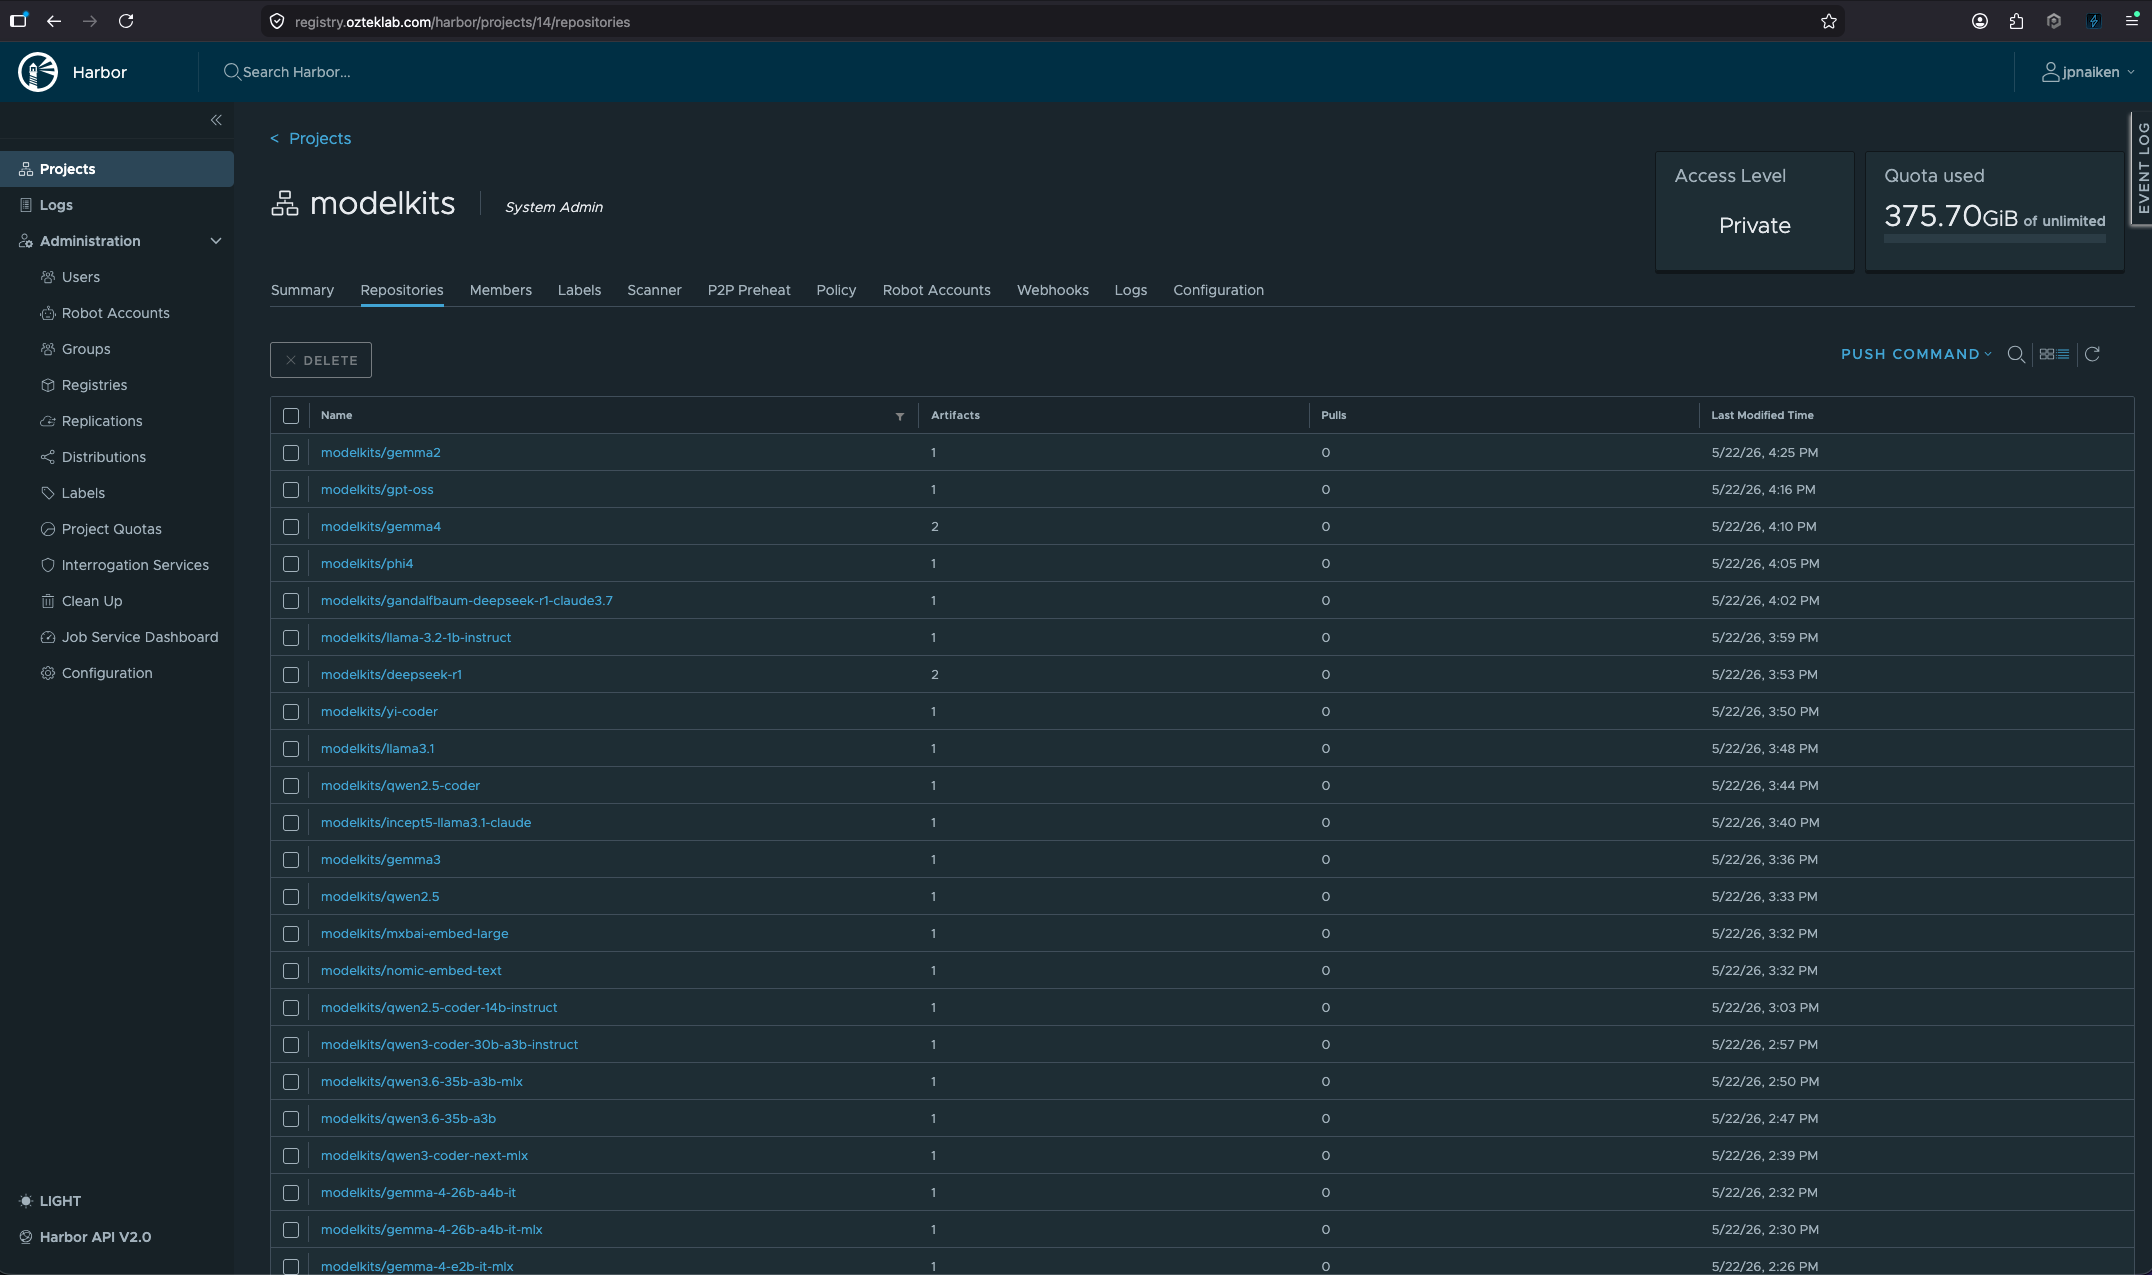
Harbor: models as OCI ModelKits
The actual models live in Harbor at registry.ozteklab.com, in a dedicated modelkits/* project. They're not Hugging-Face-style folders, they're OCI ModelKits packed with KitOps. A ModelKit is an OCI artifact (same primitives as a container image) that bundles the model weights + a Kitfile manifest + tokenizer + license + a SHA digest. Each one is signed with cosign. The registry currently carries a growing mix of GGUF families for the NVIDIA side (Qwen, Gemma, Llama-3, DeepSeek, Phi-4, GPT-OSS, Yi, plus Qwen-Coder variants for the IDE workload) and MLX families for the Mac side (Gemma, Qwen, Phi, Llama in 4-bit, 6-bit, and bf16), with more MLX pushes following the same kit pack . && kit push pattern straight from the Mac Studio.
The flow on a new model is:
Why bother? The first time you delete a model from local disk and find your "production" inference path is silently re-pulling 16 GB of GGUF from huggingface.co on a public-internet round-trip, the cost-benefit becomes obvious. With Harbor + KitOps you get content-addressed, signed, internal artifacts, the same supply-chain story containers had ten years ago, finally applied to model weights. Harbor's storage backend is the lab's RustFS S3 cluster (s3.local), so the same disk that holds Kubernetes PVCs and blog assets also holds the model artifacts. One backup story, one retention policy.
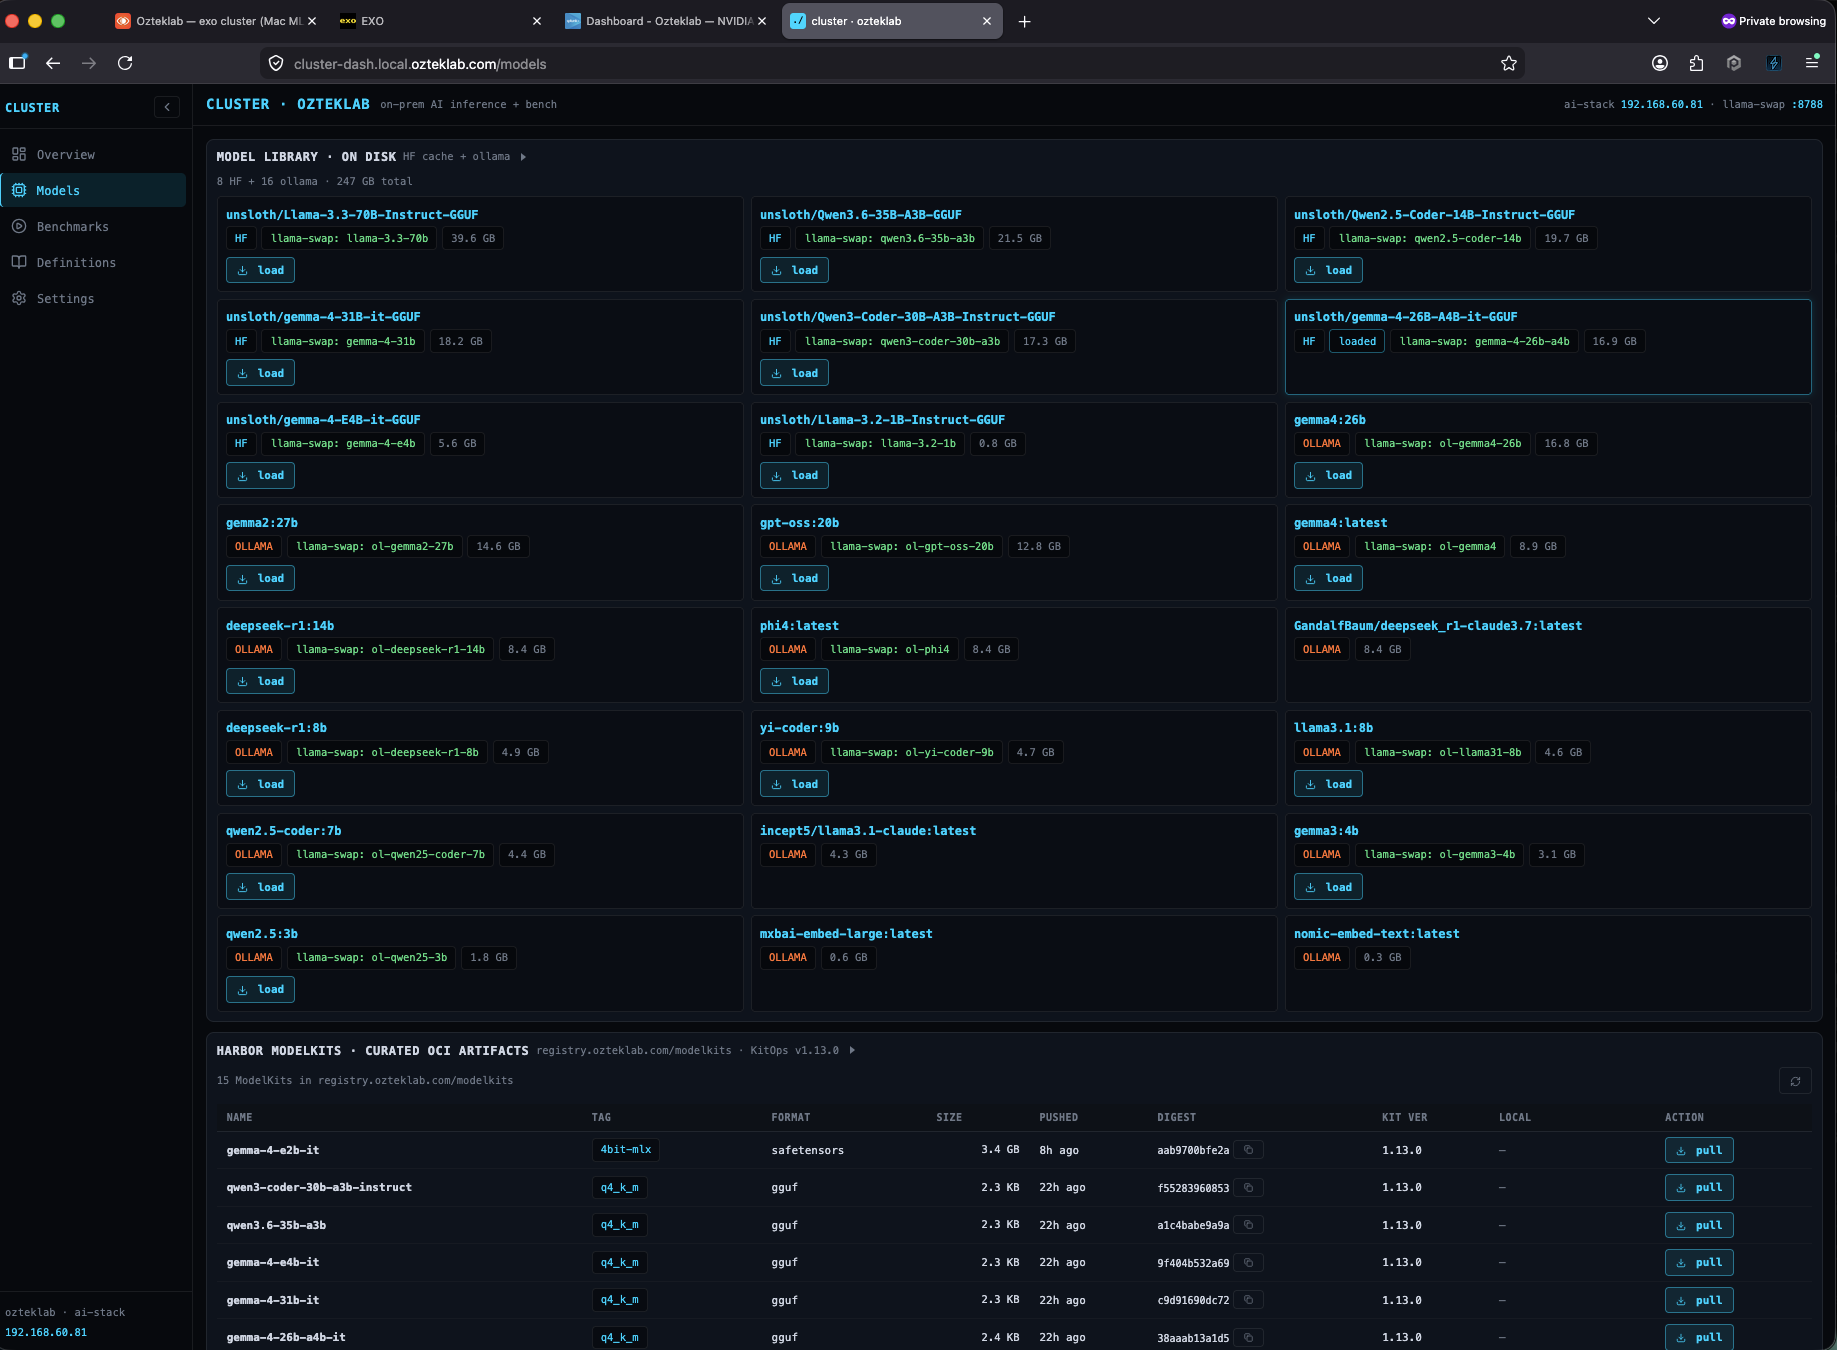
cluster-dashboard: the operator UI for the whole pipeline
The custom cluster-dashboard (the same FastAPI + React app you saw earlier) has a dedicated HF Browse tab that searches HuggingFace's API (via the Nexus mirror), shows model family / size / quantization metadata, and exposes a one-click Pack + Push action that drives kit pack + kit push against the model the user selected. The output lands in Harbor; llama-swap's config picks it up by name. No manual wget of GGUF files, no manual cosign sign. The dashboard wraps it all behind buttons. The Models Library tab is the read-side: a unified view across the local HuggingFace cache, the Ollama-format weights cache, and the Harbor ModelKit registry, so you can see at a glance what's "available locally", what's "in Harbor", and what's "just out there". Click load, the right backend gets pinged.
GitOps: the rest of it is code
Everything that isn't a model is in Forgejo at git.ozteklab.com/ozteklab/infra and rolled out by Flux v2 (K3s) or a small deploy.sh + placeholder render pattern (Docker hosts + TrueNAS apps). Secrets live in OpenBao (a Vault-compatible fork) at secret/*, and the deploy scripts pull them at render time using __OPENBAO_<key>__ placeholders, never committed to git. Three things this buys you, all of which I rely on weekly:


- Reproducible disasters. When RustFS went down twice on 2026-05-20 + 21 (image-layer corruption on the TrueNAS Docker overlay), the recovery wasn't "remember what I did last time", it was "run the runbook + read the GitOps manifest + redeploy". The whole thing was back in 5 minutes the second time, vs ~30 the first.
- Atomic rollbacks.
git reverton a misconfigured otelcol pipeline rolled the whole observability fan-out back to the previous state in under a minute. Flux reconciled, otelcol restarted, dashboards live again. - Audit trail by accident. Every change is a commit. When a kube-vip flap chronic-fix landed back in May, the why-and-when was sitting right there in the commit message (memory: kube-vip chronic flap recipe for the curious).
The reason I'm bothering with all of this for what is, after all, a hobby AI cluster, is that a half-built lab teaches you the wrong lessons. If the lab doesn't model the supply chain properly, the dashboards you build on top of it don't measure anything that translates back to a real platform. Harbor + KitOps + Nexus + Flux + OpenBao isn't overkill for "just AI inference", it's the price of having the lab behave like a small platform team's environment, with all the same audit, rollback, and reproducibility expectations. The lab pays for itself the first time something breaks at 2 a.m. and the runbook is git pull && flux reconcile.
4. Power telemetry: macmon → OpenTelemetry
This is the new bit, and it's the reason I'm posting.
EXO.app bundles a small Rust binary called macmon that reads Apple-silicon power and temperature data via Apple's IOReport framework. EXO's own topology UI uses it to show per-node wattage live. That data is exactly what I want as a queryable metric series across my whole observability stack, but it's locked inside EXO.app's UI.
So I wrote a 120-line Python adapter that runs macmon pipe --interval 5000 as a subprocess, parses each JSON sample, and POSTs it as OTLP-format gauges to my central OTel collector on ai-stack:
Stdlib only, no requests, no opentelemetry-sdk. Just urllib.request.urlopen. It runs as a per-user LaunchAgent on both Macs and sends every 5 s. Happy to share the full adapter if you want it published, drop me a message via the contact form.
What lands at the central otelcol (and then fans out to all three backends):
| Metric | Unit | What |
|---|---|---|
mac.power.total | W | Whole-board power draw |
mac.power.gpu | W | GPU domain (where MLX inference runs) |
mac.power.cpu / .ane / .ram / .system | W | Per-domain breakdown |
mac.temp.{cpu,gpu} | Cel | Avg die temperatures |
mac.gpu.usage | 0–1 | GPU utilization fraction |
mac.cpu.{e,p}cpu_usage | 0–1 | E-core / P-core utilization |
mac.memory.ram_{used,total} | bytes | Memory pressure |
Resource attributes: host.name, cluster=mac-exo, deployment.environment=ozteklab-lab. Standard OTel hygiene, everything is filterable.
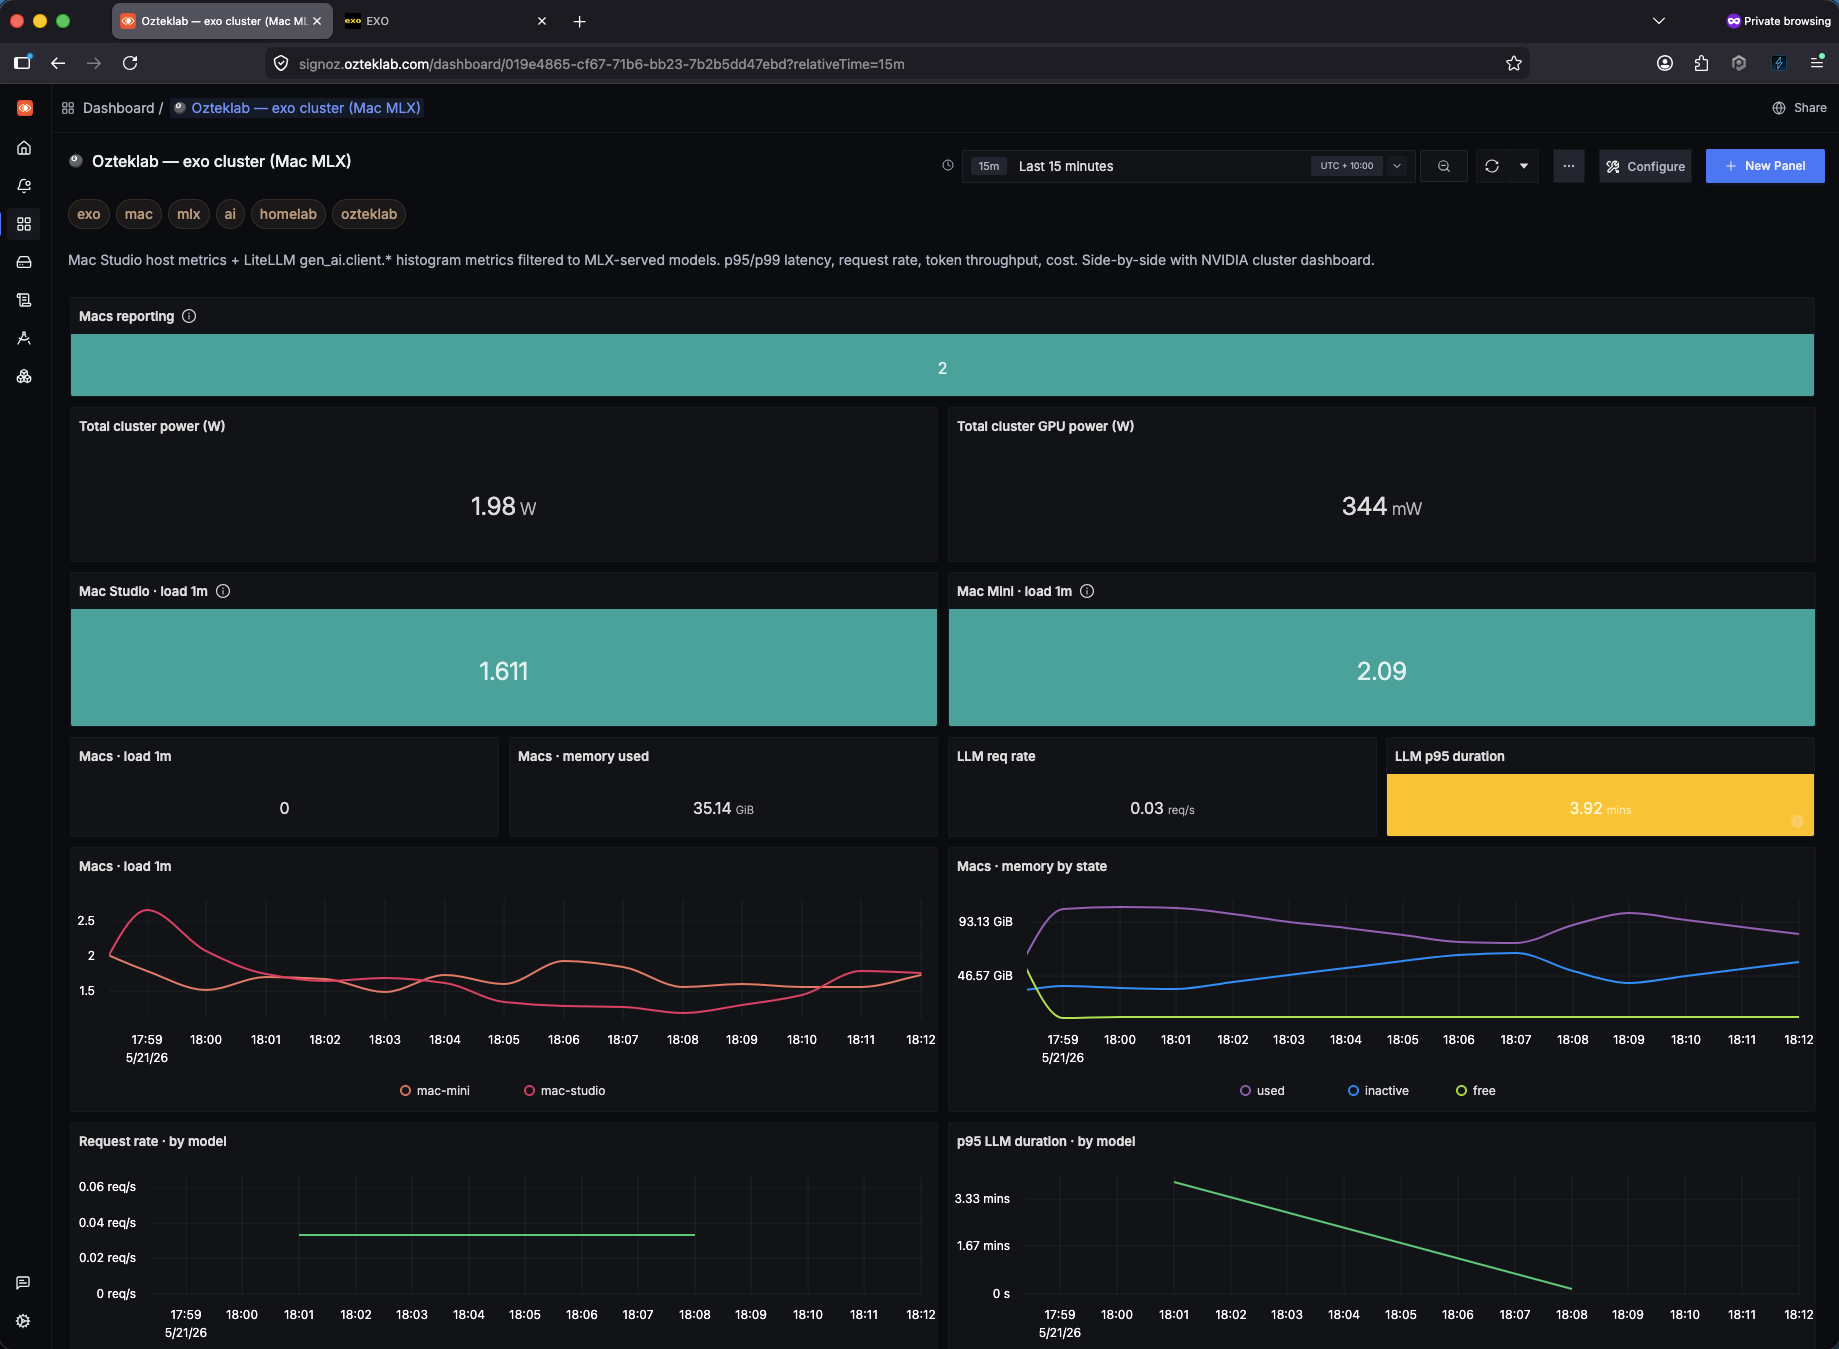
A SigNoz query against this looks like any other gauge:
And the answer right now, with the cluster idle: ~20 W across both Macs. Under inference (Qwen3-Coder generating): ~60–80 W. That's the raw power signal, the same number EXO's UI shows internally, now landing as a real OTel gauge that any dashboard can query. The ratio (tokens / watt, the actual efficiency number) is the obvious next panel to build, the two source streams are both flowing into SigNoz already, see the cluster-dashboard section.
5. Four gotchas worth their own headlines
These are the things that ate my time. Documenting them so they don't eat yours.
4.1 macOS silently blocks unsigned binaries from LAN, even though ping, curl, and nc all work
This one took me 30 minutes the first time and 5 minutes every time after because I finally wrote it down.
You install otelcol-contrib from the upstream GitHub release on a Mac. It's a Go binary with ad-hoc linker signing (Signature=adhoc, no Apple notarization). You start it. Logs look fine. Then this in the export-error stream:
dial tcp <ai-stack-ip>:4318: connect: no route to host
Meanwhile, from the same shell:
macOS 14+ enforces a Local Network privacy framework on every process trying to reach an RFC1918 address. Unsigned binaries can't request the permission (no app bundle to attach the prompt to), so the syscall returns EHOSTUNREACH silently. There's no log line. The TCC database doesn't show a denial. You just get a fake "no route to host" forever.
Fix: codesign --force --deep -s - /path/to/binary (ad-hoc signature). After that, the first launch of the process triggers the popup; user clicks Allow; the grant persists per cdhash.
Sub-gotcha I burned on later: re-signing an already-signed binary strips the grant, even when the resulting Signature=adhoc identifier looks identical. Don't re-codesign on every deploy, make it conditional:
4.2 open -a EXO --args ... silently drops arguments
When the Mac peers got out of sync, I tried pinning EXO's libp2p port to make bootstrap deterministic across reboots:
EXO bound a random port. Args were dropped. macOS's open accepts --args but the receiving .app has to declare it intends to read them; most bundled apps don't.
What works: invoke the bundled binary directly.
What breaks if you do that: the bundled macmon subprocess can't spawn anymore (loses the .app's signed entitlements), and the topology UI's power column goes to 0. You can't have both. I chose the .app launch (wattage matters more than fixed port; cross-VLAN peer discovery via mDNS reflector works fine without).
4.3 libp2p mDNS across VLANs needs a UniFi gateway mDNS reflector
EXO's peer discovery is libp2p mDNS only in the current v1 build, no config.toml, no bootstrap-peers for the Mac UI to consume even though the CLI flag exists. (I confirmed by grep -r config.toml inside the bundle: one TODO comment, never loaded.)
Apple's Bonjour service browser announcements are link-local multicast, they don't cross L3 boundaries unless something forwards them. UniFi has had a built-in "Multicast DNS" / Bonjour reflector for years; you enable it per-VLAN. Mine had to span VLAN 60 (Mac Studio) and VLAN 80 (Mac Mini, on the Coder workspaces VLAN).
Two clicks in UniFi UI → both Macs see each other → EXO topology shows both nodes connected → MLX Ring inference works across the pair.
4.4 Splunk Observability Cloud silently rejects new metric names on trial accounts
The OTel collector reports otelcol_exporter_sent_metric_points{exporter="signalfx"} 979675, send_failed=0. The SignalFX ingest API returns 200 OK to direct mac.power.total POSTs. The metric never appears in /v2/metric or in SignalFlow queries.
You've hit the trial-account custom-MTS cap. The org-info endpoint returns metricTimeSeriesLimit: null when you're already past it. No error message anywhere in the pipeline.
Mac power data lands in SigNoz (self-hosted, no quota) and Splunk Enterprise (lab_otel_metrics index, on-prem, no quota) just fine. Only the cloud trial silently dropped it. Diagnostic check: confirm the metric exists in lab_otel_metrics:
You'll see all 13 mac.* series. The pipeline is healthy; the trial backend is just done with you.
6. Dashboards in three places
Same shape across backends so the screenshots are comparable:
- SigNoz (exo, NVIDIA): row 1 cluster headline tiles, row 2 per-host load, rows 3-5 LLM perf, rows 6-7 token rate + cost, rows 8-9 power (the new bit).
- Splunk O11y (exo, NVIDIA): identical layout, SignalFlow programs instead of SigNoz QueryBuilder. Limitation: SignalFX flattens OTel histograms to count/min/max only, so no p50/p95/p99 latency panels, just min/max/rate.
- Splunk Enterprise dashboards: SPL with
tstatsoverlab_otel(logs) andmstatsoverlab_otel_metrics(metrics). Power data queryable today with| mstats avg("mac.power.total") WHERE index=lab_otel_metrics BY host.name.
Two SigNoz-specific patterns that paid off:
-
The
Macs reportingcount tile uses a ClickHouse SQL panel rather than a builder query, because SigNoz's value-panelreduceTo: countshows the first series's label (e.g.mac-studio) instead of the series count. Directcount(DISTINCT host.name)SQL fixed it. -
For the LLM perf panels, use
gen_ai.usage.input_tokensandgen_ai.usage.output_tokens, notprompt_tokens/completion_tokens. Both names exist in SigNoz schema discovery; only the new semconv names are actually populated by LiteLLM. Hours of empty panels until I queried both.
7. The operator UI: cluster-dashboard
There's a piece of glue I haven't talked about in this post but it's the one I look at most often: cluster-dashboard, a FastAPI + React app on :8801 that gives me an octagon-topology view of every node, a live nvidia-smi/macmon panel, model load/unload buttons that talk to llama-swap, and an in-browser benchmark that streams tokens directly from llama.cpp's OpenAI endpoint while recording p50/p95/TTFT/tokens-per-second into a SQLite history table. It's how I made the side-by-side Mac-vs-NVIDIA comparison concrete instead of vibes.
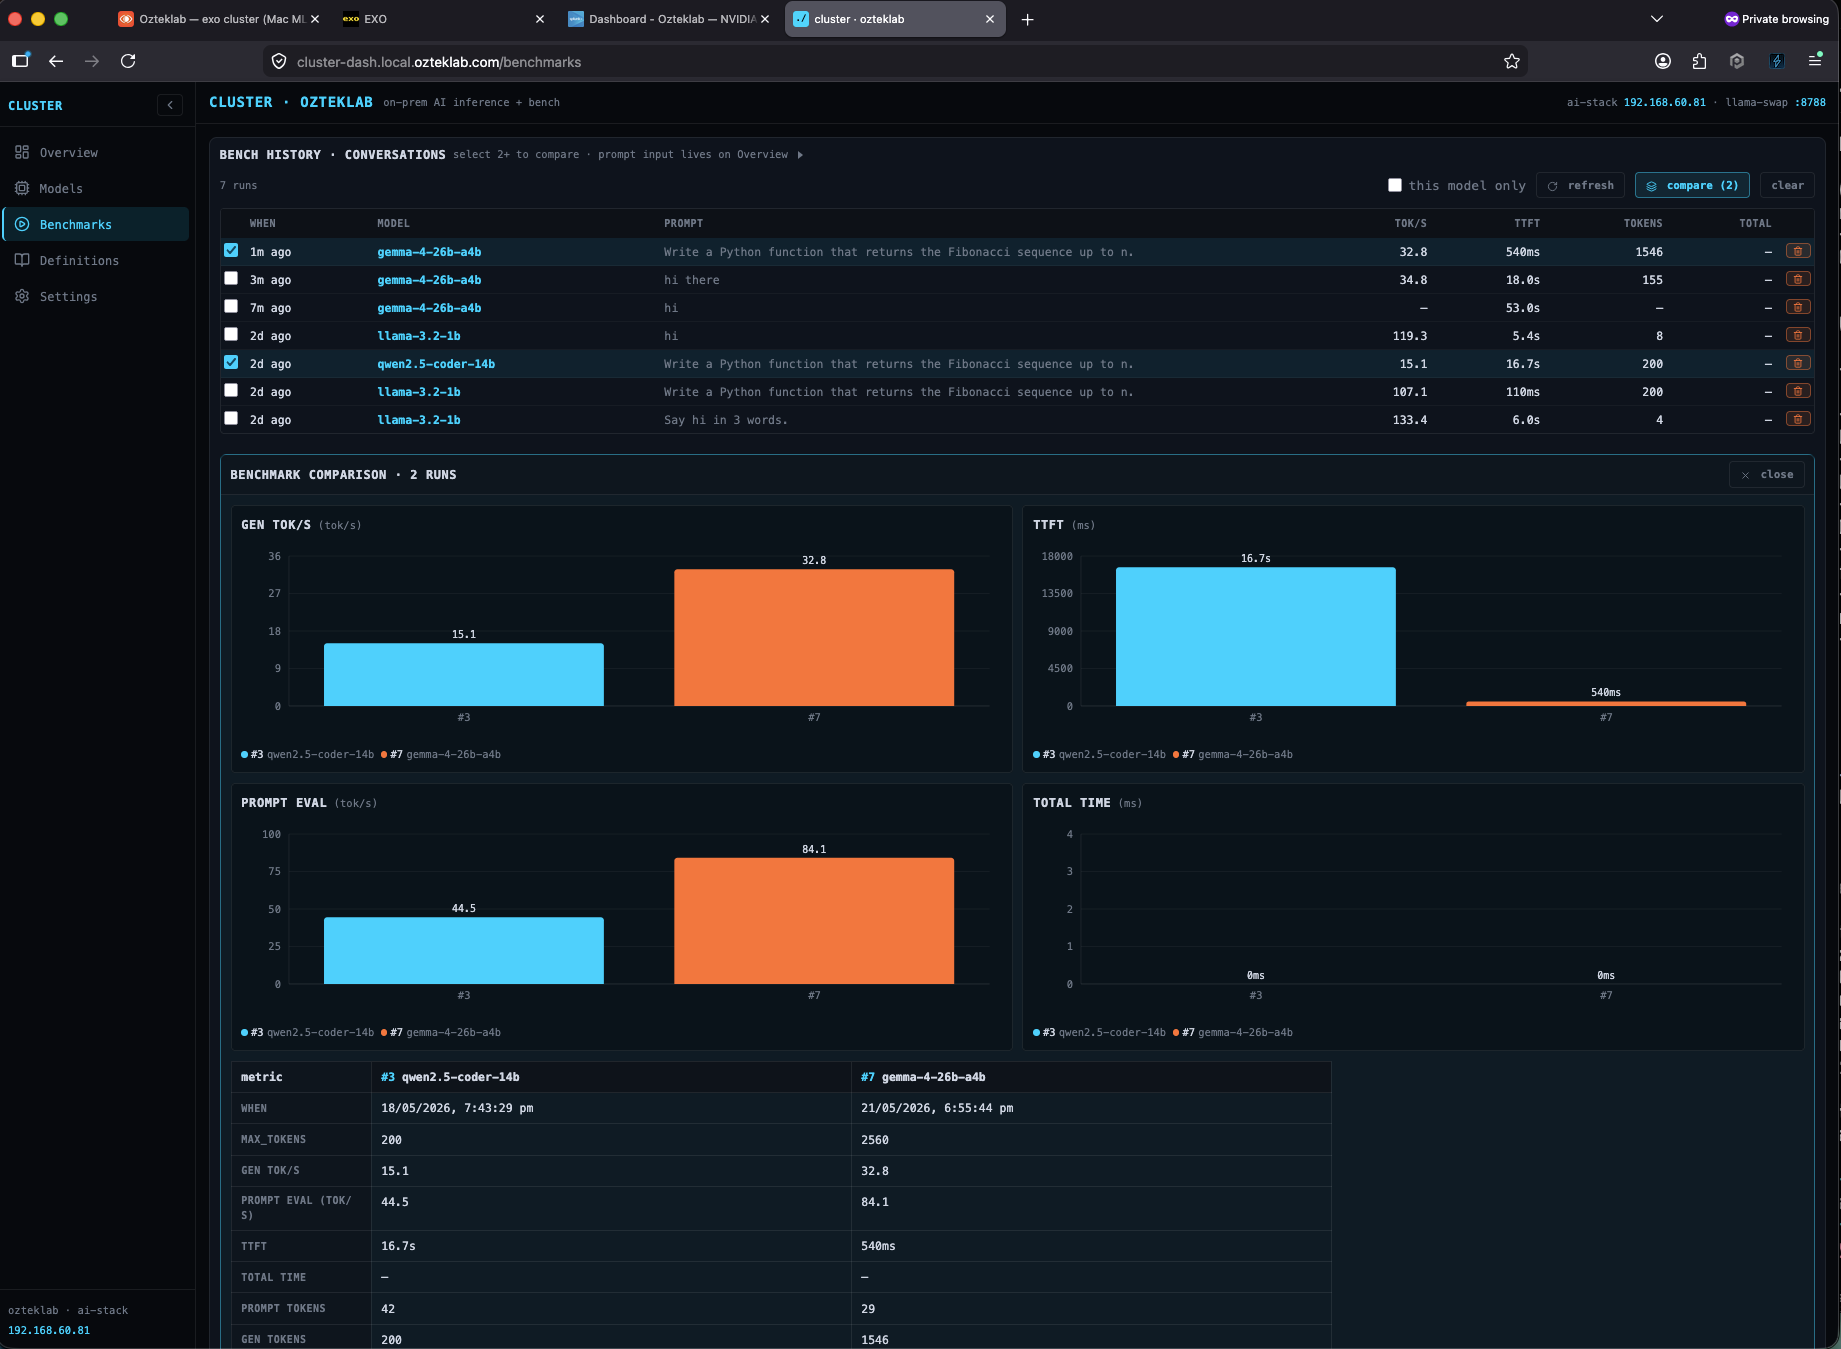
The Models library page is the unified view across HuggingFace cache and Ollama-format weights, with quick-load buttons and live VRAM accounting. The benchmark compare view puts two runs side-by-side so the A/B is concrete instead of a vibe-check:
The benchmark flow: pick a model, drop in a prompt, click Run. Tokens stream live; metrics fill in as the response completes. Every run is persisted so you can compare apples-to-apples across models, prompts, max_tokens settings, and RPC vs LOCAL backends.
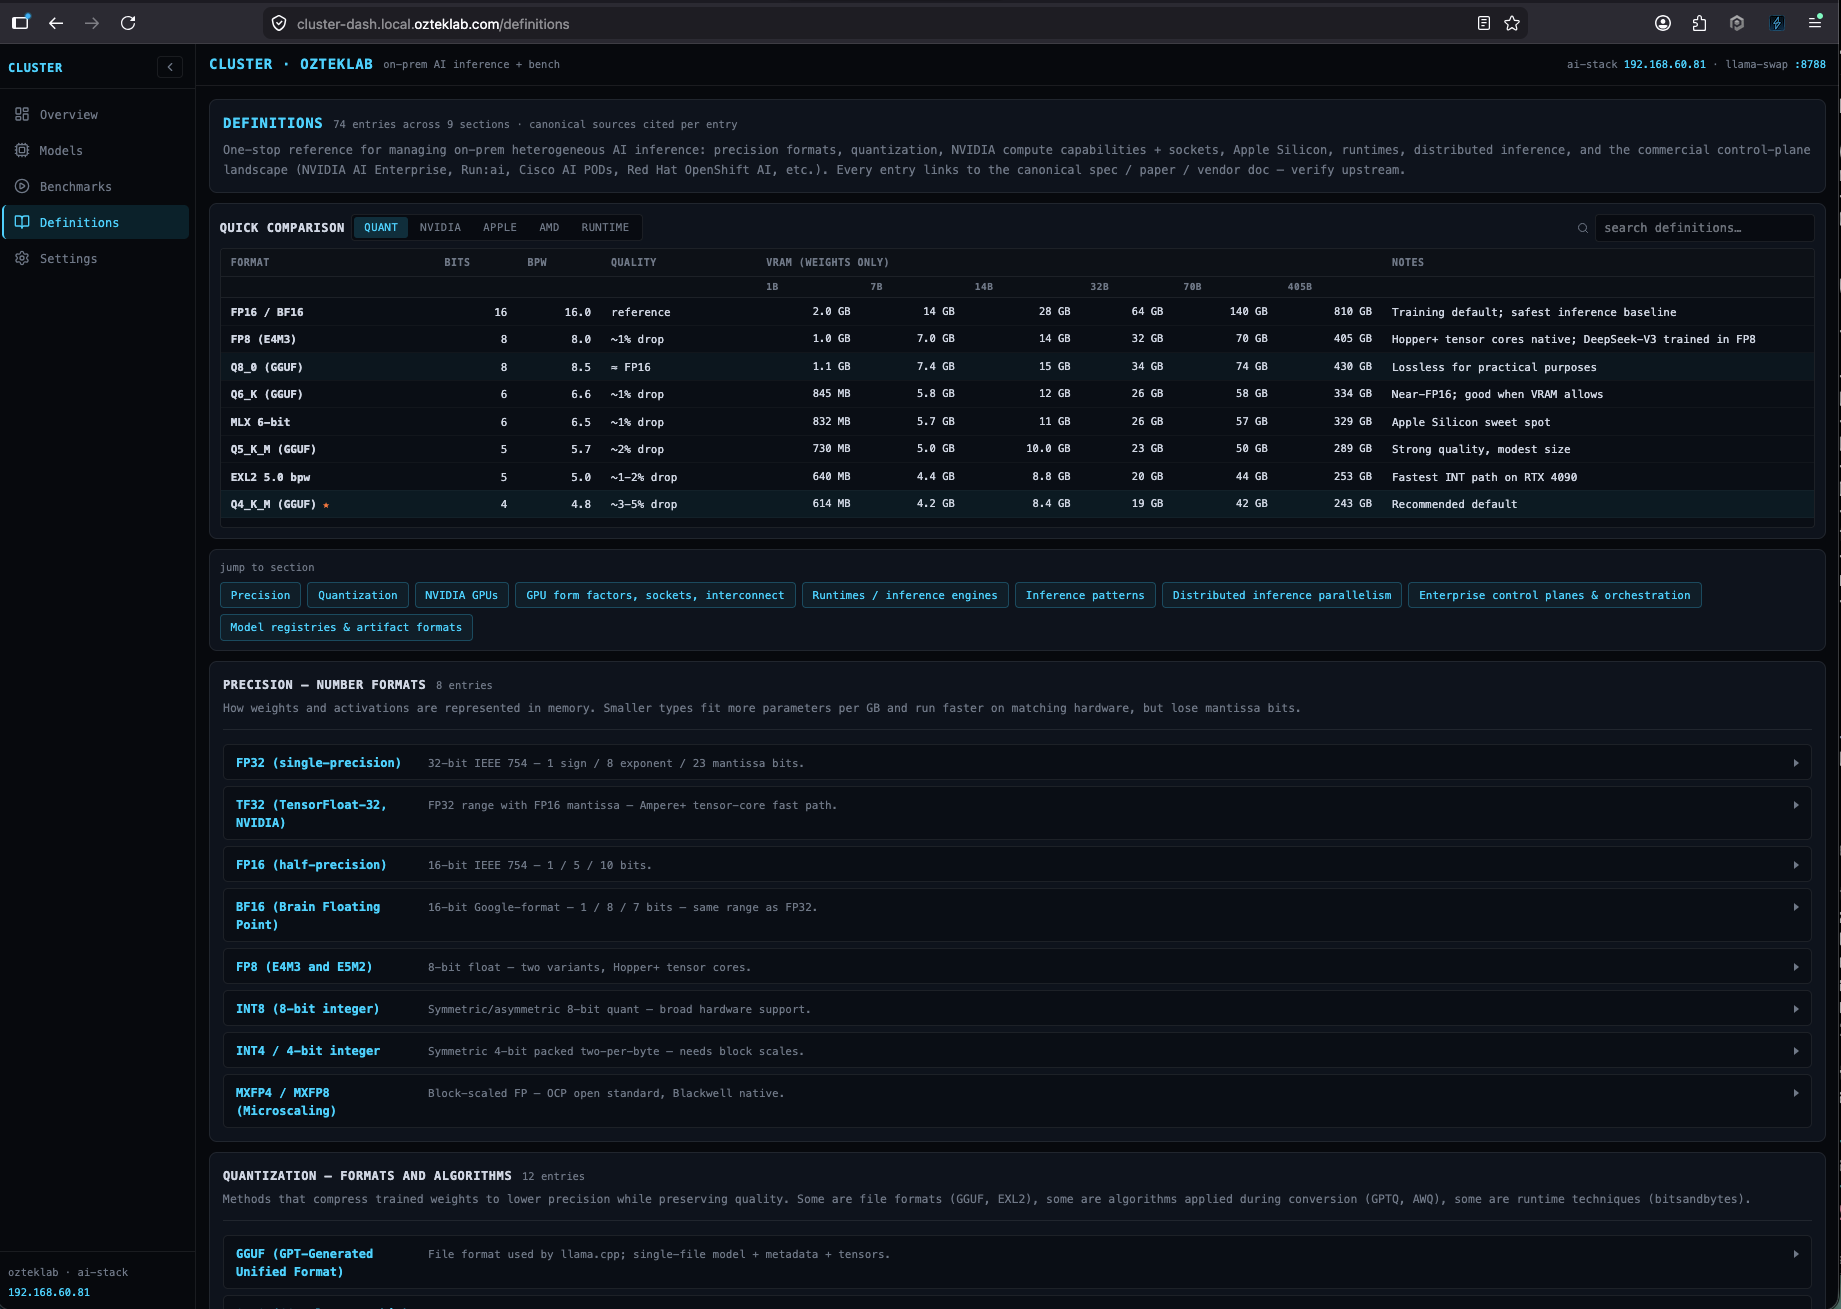
I also put a Definitions tab in the dashboard with the quantization / precision / context-length / MLX-vs-GGUF glossary I keep wishing existed when I'm onboarding the next person to the lab, sources cited, no AI-generated waffle:
And the same Mac cluster, viewed through EXO.app's native UI on Mac Studio, same model, different operator perspective:
Sample output from a qwen2.5-coder-14b run against the local NVIDIA cluster, same OpenAI API contract any client expects, no remote calls, ~15 tok/s on the M6000 standalone (cluster-dashboard benchmark history, not a vibe number):
8. The hardware story behind this lab (and what's next on the NVIDIA side)
This is the part for the hardware nerds. The M6000 is doing a job that the internet wrote off as "e-waste", and the lab is wired today to slot in a V100 SXM2 32 GB drop-in as soon as one lands. The plan:
- SXM2 V100 32 GB. I've already sourced one and I'm waiting on delivery. The first build is deliberately small: a single SXM2 module on a single-card SXM2-to-PCIe adapter with a 3D-printed shroud and a high-static-pressure fan. The V100 itself is a passive heatsink, the SXM2 connector is server-only, so the adapter is mandatory. Worth saying clearly because people get tripped up here: this is a headless accelerator, not a GPU you plug a monitor into. There's no display output. Its only job is to expose CUDA to whoever is running inference. The plan once it's in the rig is to PCI-pass-through to a Proxmox VM, run a K8s worker inside the VM, and use the NVIDIA Device Plugin's time-slicing mode so the V100 can serve multiple pods (MIG is A100/H100-only, so time-slicing is the right path for Volta). The real reason to do this in single-card form first is vLLM: vLLM has been actively dropping
sm_70support, and to use a V100 with current vLLM I'd need to maintain a fork with the Volta kernels patched back in (community forks like1Cat-vLLMexist). One V100 is the right cheap test to decide whether that fork is worth carrying long-term. If it is, the natural scale-up is the 1CATai TECH TAQ-SXM2-4P5A5 quad carrier out of China, the only board on the second-hand market that actually routes NVLink 2.0 between SXM2 slots itself (the cheaper Supermicro AOM-SXM2 pulls only work when bolted into the proprietary DGX-class motherboard they came out of, otherwise they're dumb power boards with no NVLink). With a 1CATai-class board,nvidia-smi topology -mlights up a real mesh and you get ~300 GB/s peer-to-peer on a desktop budget, without paying the DGX tax. The realities at that scale: 4× V100 SXM2 pulls 1.2 kW under load (1600 W+ PSU), external SlimSAS / PCIe riser back to the host board, and serious cooling. Community reference for the consumer-PC side is l4rz's "poor man's supercomputer" writeup, and the topic lives in r/LocalLLaMA more than anywhere else. Do your own research, the parts get harder to source every month as more people catch on. - M6000 stays in the rig, second card for embeddings, vision pre-processing, and small models the router shouldn't have to swap. Nothing gets retired; everything earns its rack space.
- Add the V100 as a fourth member of the RPC ring, currently 1 M6000 prefill + 3 RPC workers; V100 becomes the workhorse for the 70B-class models the M6000 has to RPC-shard.
- EXO ring + NVIDIA RPC ring side-by-side, same prompt, same client, same dashboard, four backends now (Mac Studio, Mac Mini, M6000, V100). The watts/token comparison gets sharper because Volta in INT8 is a different efficiency curve than Maxwell or Apple Silicon.
The honest constraint on the SXM2 plan is software, not silicon. The serving ecosystem is moving on from Volta (compute capability sm_70):
- vLLM still technically supports sm_70, but in practice, v0.20+ has broken kernel paths, BF16 isn't supported on Volta at all (BF16 requires compute capability 8.0+), and newer models hit
no kernel image is availableerrors on V100 (vLLM issue #25456). Community forks like1Cat-vLLMbackport CUDA 12.8 + AWQ kernels to keep V100 viable, but you're maintaining your own fork the moment you commit to that path. - TensorRT-LLM, TGI, and Triton have all dropped sm_70 from their current container releases.
- llama.cpp, the actual home of this lab's NVIDIA side, treats Volta as a first-class target. CUDA 12.x compiles cleanly, Q4_K_M/Q5_K_M paths work, FlashAttention-2 isn't supported on Volta but the regular attention path is fine for inference. This is why the cluster doesn't depend on vLLM at all, and why a V100 drop-in won't break it.
So: when the SXM2 arrives, the work is rebuild the llama.cpp container with sm_70 enabled, plug in the carrier, register it as a new RPC node, update the cluster-dashboard topology. That's an afternoon. The vLLM rebuild, if I ever need it, is a fork-and-pin-and-pray exercise; the lab's design deliberately avoids needing that.
The fabric upgrade after that, getting off 10 GbE for RPC
Once the V100 is in and the RPC ring goes from three workers to four, the next constraint is the wire. The lab currently rides a 10 GbE switching fabric, which is plenty for everyday traffic but is also exactly the bottleneck I called out in the RPC table back in section 1 (32 tok/s standalone collapses to ~9 tok/s sharded, and per-token activation sync is what eats it). The fix is QSFP, not faster GbE. Two paths I'm actively pricing:
- Buy a GB10 Blackwell box and ride its built-in ConnectX-7 fabric. The ASUS Ascent GX10 is the one I'm looking at to add to this lab. Same GB10 silicon as the NVIDIA DGX Spark, but the ConnectX-7 layout is the headline feature for what I'm trying to do: dual 200 Gbps QSFP56 (or QSFP112 on the GX10), with an optional 400G DAC cable, designed end-to-end for 2-node clustering, which extends naturally into a small fabric if you uplink to a QSFP switch instead of doing point-to-point. The GX10 / DGX Spark gives the lab a real, ConnectX-7-class member it can RPC-pair with the M6000+V100 ring without having to retrofit QSFP into the existing Proxmox hosts.
- Retrofit 100 GbE PCIe cards into the existing PVE hosts and pass them through to the RPC worker VMs. Cheaper per port than the GB10 box but the work is messier: PCIe slot inventory on the PVE hardware, driver + IOMMU pass-through to the VMs, cabling, switch port count, all add up. The shape this takes will depend on what the GX10 ends up doing for me first.
The Mac side has an interesting wrinkle. The Mac Studio's Thunderbolt 5 ports run at up to 120 Gb/s, which is close enough to 100 GbE that "Mac Studio joins the QSFP fabric via a Thunderbolt-to-PCIe enclosure with a Chelsio T6 series NIC" becomes a real option, not a hack (Chelsio is the safer macOS bet here, Intel's 100 GbE drivers on macOS are unreliable). The Studio has to be physically close to the rack, or a QSFP-to-QSFP switch port has to absorb the link, but the bandwidth side of the equation lines up. There's even a running thread on Hacker News about RDMA over Thunderbolt 5 on Mac Studio that's worth tracking if you're heading down this path.
The point of this section is not "I bought a 200 GbE switch yesterday", it's that the lab's NVIDIA-side roadmap is silicon first (SXM2), then fabric (ConnectX-7 either via GB10 box or via PCIe retrofit), then the Mac onto the same fabric. Each step has a real shopping list and a measurable expected win. None of it is "wait for the next Mac Studio to fix everything".
9. Why all this exists: the post-training endgame
The whole stack in this post, two clusters, the LiteLLM router, the OTel fan-out, the Harbor + KitOps registry, the cluster-dashboard, even the SXM2 V100 experiment, is the foundation. It is not the point. The point is the next thing.
The next thing is post-training my own small model on my homelab's own documentation. The lab generates a lot of operational knowledge: Outline docs for every service I run, runbooks, migration notes, incident postmortems, GitOps commit history, Mattermost threads where I worked something out, the chunks already in my RAGtronic Qdrant collection. A fine-tune of a 7-14B base model on that corpus gives me a local model that actually knows this environment, not a generic assistant being prompted with a vector search every time, and not a cloud model with my entire homelab leaking into someone else's training set. Everything stays on-prem. The pipeline is already partly there: Outline MD pull, preprocess, fine-tune (this is where the V100 starts earning its rack space), evaluate, and push the trained checkpoint back into Harbor as a signed ModelKit under modelkits/ozteklab-*. Same registry, same signing, same cluster-dashboard tracking as every other model. Inference on the trained model uses the same LiteLLM front door as everything else, so swapping in/out is a model-name change, not a re-plumbing job.
That post-training loop adds one more piece to the stack: model lifecycle tracking, something like MLflow or Weights & Biases self-hosted. Hyperparameters, eval metrics, dataset versions, and the SHA digest of each trained checkpoint all need to be queryable so I can answer "why is ozteklab-7b-v3 better than v2?" three months from now. That's the next deploy: an MLflow tracking server on the K3s side, RustFS-backed artifact store, OIDC via Authentik. Slots cleanly into the GitOps repo + the same observability fan-out.
So the SXM2 V100 isn't just a "can I run a bigger model" experiment, it's the test for whether the entire heterogeneous-AI-plus-local-fine-tuning hypothesis is worth the hardware investment. If one V100 with a hand-maintained vLLM Volta fork produces a useful fine-tune on my Outline corpus, the quad-NVLink path becomes a real plan, and the whole stack stops being "a cool homelab" and starts being "the production training + serving environment for a one-engineer AI/ML team". Everything else in this post exists to make that step feasible without paying cloud-scale prices.
10. What's still missing
- The Splunk O11y trial dies in a few days. Power data won't be in the cloud screenshots until either the trial extends or I move to paid. Not worth chasing further on a clock.
- NVIDIA-side power telemetry.
nvidia-smigives me total board watts per second; need a similar Python adapter to emitgpu.power.{board,sm}as gauges. Should take an evening. - Tokens-per-watt as a dashboard metric.
rate(gen_ai.usage.output_tokens) / mac.power.gpugives a tokens/W series per model. The maths is one formula away; just need to ship the panel. - Cost overlay. When the metric lands, divide power × your local electricity rate to get $/1k-tokens on-prem. That's the real comparison vs OpenAI API pricing, and the bit that makes the on-prem ROI story land.
- The MLflow + post-training pipeline itself, see the post-training endgame. Foundations are in place; the training-loop deployment is the next blog post.
The full architecture, scripts, OpenTelemetry collector config, and dashboard JSON live in my private homelab GitOps repo. If anything in this post is useful for your setup and you'd like the specific piece published on GitHub, the macmon adapter, the SigNoz dashboard JSON, the otelcol config, the LaunchAgent plists, please drop me a note via the contact form and I'll publish the relevant bits. If the gotcha section saved you an hour, that's why I wrote it.